


Data profiling is a very important step that is highly recommended before beginning a project. This feature allows the user to get quickly obtain an understanding of what the data is comprised of as well as indications of potential issues contained within. This information will help the user determine what should be cleansed and what may be used as criteria for matching the data.
The following screenshot includes numbered labels which are described below:
-
 Click the Generate Profile button to run a profile on one or more data sources.
- The Profile History will open the directory of all previously run profiles.
- Pattern Options is the list of premade patterns that will be used to compare to the data source. These identified patterns may be used during the cleansing and standardization step of the process.
- The user may manually export this profile to the desired format.
- The field name is the column header.
- This shows the percentage of filled or non-empty fields.
- The type field will indicate the type of field (ex: date, numeric, string, etc.).
- The values in the column will show the max length in characters.
- The Pattern section will show the following.
- The pattern will describe the type of pattern that was identified.
- Total is the total number of records both blank and unblank.
- Valid returns the number of the fields whose value is valid to be used with the identified pattern.
- Invalid returns the number of the fields whose value is invalid to be used with the identified pattern.
- The Count section shows the number of fields that have some value in them (filled), blank or null (Null), and unique, non-repeating values (Distinct).
- The Character Count section will show the following:
- The count of fields that contain numbers.
- The count of fields that contain only numbers.
- The count of fields that contain letters.
- The count of fields that contain only letters.
- The count of fields that contain letters and numbers.
- The count of fields that contain punctuation.
- The count of fields that contain leading spaces.
- The count of fields that contain Non-Printable Characters.
- Aggregate Values will provide numeric statistical information when the field type is numeric or date.
 Click the Generate Profile button to run a profile on one or more data sources.
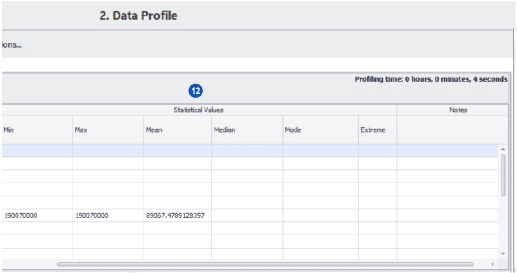
-
- Stats Detail will show the user the data that matches the value when clicked in the profile table above
- Pattern matches will show the possible patterns that would match the values in the selected column
- Map Chart will take the zip codes from a data source and plot them on a map of the United States.
Want to see DME’s Data Profiling in action? Check out this video.