


Last Updated on March 30, 2026
76% of organizations say data-driven decision-making is their top goal for 2025. However, 67% of data and analytics professionals don’t fully trust the data used by their organizations and 45% of companies cite poor data quality as the biggest obstacle to the success of their data programs.
Many businesses take the quality of their data for granted – expecting it to work out on its own, without putting in any effort to build and strategize data quality plans. But that’s not how it works. Data doesn’t clean itself. Without intentional action, the hidden data quality issues continue to erode your business from within.
How to Improve Data Quality?
Improving data quality isn’t a one-size-fits-all process. Different tools and techniques address different data issues, and the exact nature of data quality improvement process you need depends on what you are trying to achieve with your data. For this reason, we suggest dividing your data quality improvement journey into three phases:
- Define what to achieve: The strategy
- Design how you will get there: The plan
- Deliver and monitor outcomes: The evaluation
In the following sections, we’ll dive deeper into each phase and explore actionable steps and best practices to ensure your data quality initiatives deliver measurable results.
Establishing data quality standards for business success
Download this whitepaper and learn the struggle of hosting data in Salesforce, Fusion, Excel, and other asset management systems, and how data quality is the key factor to business success.
Download1. Define data quality improvement strategy: The WHAT
A data quality improvement strategy sets the tone for your data initiatives. However, before you can formulate it, you must find answers to two important questions:
a. How does data (in your specific case) impacts business performance?
b. What does ‘good enough’ data quality mean for your business?
Let’s explore these questions step-by-step.
a. What is the relationship between your data and business performance?
Understanding the link between data and business performance is the first step to enabling effective data management and usage.
Why it matters?
Your data drives business-critical decisions, and a clear vision sets the foundation for success. Therefore, it’s essential to first identify your objectives. Are you trying to improve customer insights, enhance operational efficiency, or support better decision-making?
How to analyze this relationship?
- Start broad: Identify high-level areas were data influences decision-making, e.g., revenue forecasting, supply chain management, and marketing performance.
- Drill down: Map specific processes where data plays a role, such as daily operations or cross-departmental information exchange.
- Ask tough questions: Once you have identified the role of data in your organization, it’s time to ask some tough questions, like ‘What will happen to KPIs if these processes are not facilitated by quality data?’
An example of such a situation is when the C-level executives set the target revenue for the next quarter based on the last quarter’s sales data, but only to find out that the dataset used to forecast future target had serious quality issues, causing your sales department to chase an arbitrary value that has no concrete meaning.
The resulting situation will have a massive negative impact on the company’s operations and reputation due to factors like unrealistic revenue targets, misaligned goals from sales teams, etc.
How it helps?
Understanding the role of data in every running process at a company allows you to always have a case on hand for prioritizing data and its quality. This will also help you to get necessary buy-ins and attention from stakeholders – something that is crucial for making and proposing changes in existing processes to get the maximum benefits of improved data quality.
b. What is the definition of data quality for your business?
Once you know the impact of data on your business, the next step is to define what ‘data quality’ looks like for your organization, since it means different for every company.
Why it matters?
Data quality isn’t a universal standard. It’s defined as the degree to which data fulfills its intended purpose. Without a clear understanding of what data quality means in your specific case, your improvement efforts will lack direction.
How to define data quality?
To defined data quality, you first need to know its intended purpose.
- Understand your data landscape:
- Identify all sources generating, storing, or processing data.
- Catalog key attributes stored by each source, such as customer names, transaction IDs, or product details.
- Develop a metadata glossary to standardize definitions for every attribute.
2. Set acceptability criteria:
Define what constitutes acceptable data values for each attribute (e.g., format, range, completeness).
3. Choose data quality metrics:
Identify data quality metrics that measure the quality of your stored data and align with your goals. For example:
- Accuracy: Ensures data values are correct.
- Completeness: Ensures no critical fields are missing.
- Consistency: Ensures data is uniform across systems.
You should also identify data quality metrics that confirm the presence of an acceptable level of quality in your datasets. For example, you may require your dataset to be more accurate and reliable, as compared to being complete.
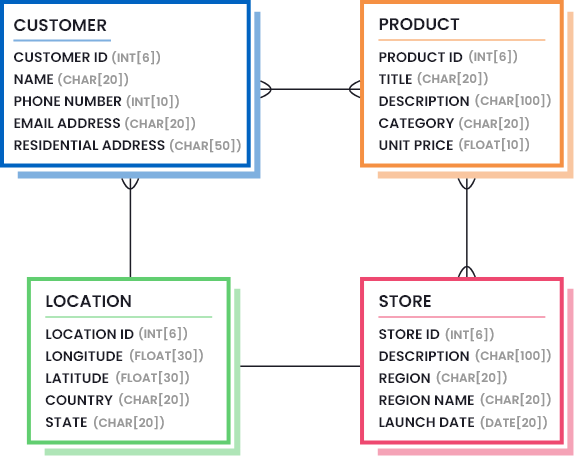
4. Use data models:
Create visual representations of your data assets, including properties, constraints, and relationships (with each other). For example, a retail company’s data model might connect customer demographics, purchase history, and inventory details, as represented in the following image:
How it helps?
A standardized definition of data quality ensures everyone – whether in IT, operations, or leadership – understands what good data looks like. This shared understanding fosters alignment and consistency across teams.
2. Design data quality improvement plan: The HOW
Once you’ve defined what clean data means for your business, it’s time to focus on how to achieve and maintain acceptable levels of data quality. A well-crafted data quality improvement plan outlines the initiatives your organization must take to achieve and sustain company-wide data accuracy, consistency, and reliability. Below are key elements to consider when designing your plan (you can add more depending on your needs and goals):
a. Establish data roles and responsibilities across the organization
It is commonly perceived that ensuring data quality at enterprise-level requires the involvement or buy-in of top-level management. The truth is, more than just involving certain individuals in siloed environments, you need to hire people in the existing processes, and clearly define roles and responsibilities for attaining and improving data quality at every level – from top management to operational staff.
What does it look like?
Some common yet important data roles and their responsibilities include:
- Chief Data Officer (CDO): A data representative in top-level management, responsible for designing strategies for ensuring effective data management, data quality tracking, and data adoption across the organization.
- Data Steward: A data quality controller, responsible for ensuring the fitness of data for its intended purpose and managing metadata.
- Data and Analytics (D&A) Leader: A data player, responsible for ensuring data literacy across the organization, and enabling data to produce value.
How it helps?
When data is treated as the main source fueling core business processes, an enterprise-wide change happens. This is where assigning roles and responsibilities in the realm of data and giving people the power to impact and speak up on crucial data issues can play a significant role in ensuring successful data culture in any organization.
b. Train and educate teams about data
A survey of 9000 employees revealed that only 21% were confident in their data literacy skills. Poor data literacy was rated as one of the top three barriers for CEOs in building strong data and analytics teams.
Introducing data roles and responsibilities can have a huge positive impact on your business. However, it is still crucial to consider that, in a modern workplace, every individual generates, manipulates, or deals with data in their daily operations. This includes capturing leads, updating customer data, and analyzing trends. For this reason, as important as it is to make certain people responsible for implementing corrective measures, it is just as necessary to train and educate all teams on how to handle organizational data.
What does it look like?
Training and educating teams about data can involve developing training programs and courses tailored to employees’ roles and frequency of data usage. These programs should cover:
- The structure and purpose of organizational data.
- Acceptability criteria for data quality.
- Correct and incorrect methods for data input and manipulation.
- How to use data effectively for decision-making?
How it helps?
The ability to correctly and accurately read, understand, and analyze data across all levels empowers each employee to ask the right questions – and in the most optimized manner. It also improves the operational efficiency of your staff and reduces mistakes while communicating matters involving data.
c. Design and maintain data pipelines to attain a single source of truth
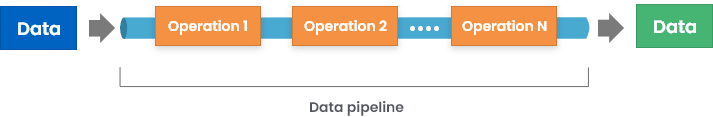
A data pipeline is a systematic process that ingests data from a source, performs necessary processing and transformation techniques on the data, and then loads it to a destination repository.
It is crucial for raw data to go through a number of validation checks before it can be deemed usable and made available to all users across the organization. A well-constructed data pipeline ensures that raw data is validated, cleansed, and standardized – converted into a single source of truth – before use.
What does it look like?
To construct a data pipeline, you need to go back to the definition of data quality. And according to that definition, you need to decide the numbered list of operations that must be performed on incoming data to attain the defined level of quality.
An example list of operations that can be performed within your data pipeline includes:
- Replacing null or empty values with standardized terms, such as ‘Not Available.’
- Transforming data values according to the defined pattern and format.
- Parsing fields into separate columns where needed.
- Replacing abbreviations with proper words.
- Replacing nicknames with proper names.
- In case the incoming record is suspected of being a potential duplicate, it is merged with the existing record, rather than being created as a new one, to prevent redundancies.
How it helps?
A well-designed data pipeline acts as a quality firewall for your organizational datasets. It helps ensure consistency across all data sources and eliminate any discrepancy that may be present – before data is even loaded to the destination source.
d. Perform root-cause analysis of data quality errors
Until now, we have mostly focused on how to track data quality and avoid data quality errors from entering the datasets, but the truth is: despite all these efforts, some errors will probably end up in the system. Not only will you have to fix them, but the more important part is that you will also have to understand how these errors came up to prevent their recurrence.
What does it look like?
A root-cause analysis for data quality errors can involve getting the latest data profile report and collaborating with your team to find answers to questions like:
- What data quality errors were encountered?
- Where did they originate from? (data collection, data entry, data storage, data integration, or any other stage)
- When did they originate?
- Why did they end up in the system despite all data quality checks? Did we miss something?
- How can we prevent such errors from ending up in the system again?
How it helps?
Getting to the core of data quality issues can help eliminate errors in the longer term. You do not always have to work in a reactive approach and keep fixing errors as they arise. With a proactive approach, you can allow your teams to minimize their efforts on fixing data quality errors – and let the refined data quality processes take care of 99% of the problems associated with data.
e. Enable data governance
The term data governance refers to a collection of roles, policies, workflows, standards, and metrics, that ensure efficient information usage and security and enables a company to reach its business objectives.
What does it look like?
Core data governance activities include:
- Implementing role-based access control to ensure only authorized users can access confidential data
- Establishing workflows for verifying information updates
- Limiting data usage and sharing
- Collaborating and coordinating on data updates with co-workers or external stakeholders
- Enabling data provenance by capturing metadata, its origin, as well as updating history
How it helps?
Data governance and data quality go hand-in-hand. You cannot sustain the quality of your data for long if unauthorized users can access it or there is no verification method to approve data updates. Governance frameworks ensure data quality is sustained over time.
f. Utilize technology to attain and sustain data quality
Technology is a cornerstone of scalable and repeatable data quality processes. Automation tools help reduce manual effort, optimize workflows, improve ROI, and ensure consistent results.
What does it look like?
Invest in a technological system that comes with all functionalities that you need to ensure data quality across datasets, such as:
- Data Import: Ingest data from multiple sources.
- Data Profiling: Assess data to generate data quality reports.
- Data Cleansing and Standardization: Fix inconsistencies, clean and standardize data, implement data validation rules, and transform data.
- Data Matching: Match data using exact and fuzzy matching algorithms with high-level of accuracy, as well as tune algorithms according to the nature of your data.
- Data Deduplication: Link records and establish a single source of truth.
- Data Export: Export/load results.
In addition to the data quality management features mentioned above, some organizations invest in technologies that offer centralized data management capabilities as well. An example of such a system is Master Data Management (MDM). Although an MDM is a complete data management solution embedded with data quality features, not all organizations require the extensive list of features that it offers. You need to understand your business requirements to assess what type of technology is right for you. Check out this blog post to learn the core differences between an MDM and DQM solution.
How it helps?
There are numerous benefits of utilizing technology for the implementation of processes that need to be consistently repeated to achieve long-lasting results. Providing your team with self-service data quality management tools can increase operational efficiency, eliminate duplicate efforts, improve customer experience, and offer reliable business insights.
The definitive buyer’s guide to data quality tools
Download this guide to find out which factors you should consider while choosing a data quality solution for your specific business use case.
Download3. Deliver on data quality metrics: The EVALUATION
Once you execute your data quality improvement plan, you will soon start to see results. This is where most companies run their plan in a loop and fail to realize the importance of the last phase which is results evaluation.
The goal of this phase is to identify how well the plan is performing against the set targets. Here, the key is to continuously monitor data quality and compare it against predefined data quality metrics.
a. Continuously monitor the state of data quality through data profiling
Achieving high-quality data and maintaining it over time are two different things. This is why you need to implement a systematic process that continuously monitors the state of data and profiles it to uncover hidden details about its structure and content.
The scope and process of data profiling activity can be set depending on the definition of data quality at your company and how it is measured.
What does it look like?
The process of monitoring can be automated by scheduling daily or weekly data profile reports. You can also design custom workflows to alert data stewards at your company in case data quality plummets below an acceptable threshold.
A data profile report usually highlights a number of things about the datasets under review, such as:
- The percentage of missing and incomplete data values.
- The number of records that are potential duplicates of each other.
- Evaluation of data types, sizes, and formats to uncover invalid data values.
- Statistical analysis of numeric data columns to assess distributions and anomalies.
How it helps?
Regular data profiling helps you to catch data errors early, and stops them from trickling down to customer-facing processes or critical decision-making systems. Moreover, it can help Chief Data Officers (and other leaders) to stay on top of data quality management and make the right decisions, such as when and how to fix the issues that are highlighted in the data profiles.
Read more about Data profiling: Scope, techniques, and challenges.
10 things to check when profiling your data
Data profiling is a crucial part of data conversion, migration and data quality projects. Download this whitepaper and find out the ten things to check when profiling your data.
Downloadb. Measure data performance against the set definition of data quality
While data profiling provides valuable insights, it’s critical to compare these results against your organization’s predefined data quality standards. This ensures your improvement plan is effectively moving the needle toward measurable goals.
What does it look like?
Start by identifying, and defining, data quality metrics that align with your goals and then assign acceptable thresholds to each. Examples of common metrics and their thresholds include:
- Accuracy: The extent to which dataset contains true values.
- Example Threshold: An accuracy rate below 98% may not be feasible for you.
- Completeness: The extent to which datasets are full, i.e., contain all required values without gaps or placeholders.
- Example Threshold: A completion rate of less than 90% may be insufficient.
- Uniqueness: The extent to which dataset contains unique (non-duplicate) records.
- Example Threshold: A uniqueness rate of less than 97% might indicate significant duplication issues for you.
How it helps?
Many organizations invest a lot of time and resources in fixing data quality issues but do not measure how well the data has transformed since the execution of data quality processes. The absence of data quality measurement makes it impossible to quantify the impact of data quality improvement efforts and what techniques have been the most beneficial (delivered the best ROI).
Continuous measurement enables you to refine your data quality initiatives and ensure sustained performance and tangible results.
Empower Your Business with Better Quality Data
Implementing consistent, automated, and repeatable data quality measures can help your organization ensure that its data remains accurate, reliable, and actionable across datasets.
Data Ladder has helped organizations tackle their most pressing data quality challenges and maintain data quality for over a decade now with its impeccable data quality solutions. Our flagship solution, DataMatch Enterprise (DME) – available as a standalone application as well as an integrable API – offers a comprehensive suite of tools for end-to-end data quality management, including data profiling, cleansing, matching, deduplication, and merge purge.
Ready to improve your data quality? Download the free trial of DME today or schedule a personalized session with our experts to explore how our product can help you enhance data quality.
Getting Started with DataMatch Enterprise
Download this guide to find out the vast library of features that DME offers and how you can achieve optimal results and get the most out of your data with DataMatch Enterprise.
Download