


Last Updated on April 10, 2026
When Unity Technologies’ Audience Pinpoint tool ingested flawed data in early 2022, it wasn’t just a technical hiccup – it was a $110 million disaster. This mishandling of data disrupted their machine learning models, delayed product launches, and caused the company’s stock to plunge by 37%.
This high-profile failure underscores a simple truth: poor data can bring even the most innovative companies to a standstill.
Data has become the foundation of modern business, but its value is only as good as its quality. As Gartner’s VP Analyst Ted Friedman warned,
“As organizations accelerate their digital business efforts, poor quality data is a major contributor to a crisis in information trust and business value, negatively impacting financial performance.”
Maintaining high data quality is no longer optional; it’s a necessity for staying in the business. But how can organizations ensure their data is trustworthy?
It starts with identifying key data quality dimensions that you should be tracking to maintain data integrity and prevent costly mistakes like the one Unity experienced.
Can You Use the Data You Have?

ISO/IEC 25012 standard defines data quality as “the degree to which data satisfies the requirements of its intended purpose.”
If the stored data is unable to fulfill the requirements of its organization, it is deemed poor quality and essentially useless.
Organizations invest substantial time and resources in capturing, storing, and managing data assets. However, without rigorous data quality measures to keep the data clean and error-free, these investments can quickly become futile. A recent survey revealed that over 50% of business executives believe that only 60% or less of their data is consumable. Furthermore, more than 95% reported that their companies would be more competitive, innovative, and capable of making faster decisions if their data quality were two times better.
These statistics highlight the pressing reality that a significant majority of businesses are grappling with data quality issues that hinder their operational effectiveness and strategic initiatives. To effectively gauge the current state of data quality, organizations must utilize a set of key performance indicators (KPIs) that align with their specific objectives. These KPIs provide a framework for assessing various dimensions of data quality and enable leaders to identify gaps and implement corrective measures.
In this blog post, we will explore how to measure data quality and examine different dimensions of data quality with examples. By understanding these metrics, business leaders can ensure that their organizations make full use of their data assets. So, let’s start.
How to Measure Data Quality?

As the definition made it clear, data quality means something different for every business – depending on how they wish to use the data. For example, for some businesses, data accuracy is more important than data completeness, while for others, the opposite may be true. This variability underscores the notion that data quality can be measured in different ways.
What Is a Data Quality Dimension?
A data quality dimension refers to a specific metric that quantitatively measures data quality.
These dimensions help organizations systematically assess how well their data meets its intended purpose.
How Many Data Quality Dimensions Are There?
There is some debate regarding the number of data quality dimensions. You will often find some experts asserting that there are six dimensions of data quality, while others argue there are eight. Since there are different way to measure data, the number and types of data quality measures can vary depending on how you want to use your data. The six commonly recognized dimensions include:
1. Accuracy: The degree to which data correctly reflects the real-world state it represents.
2. Completeness: The extent to which all required data is present and accounted for.
3. Consistency: The uniformity of data across different datasets and sources.
4. Timeliness: The relevance of data with respect to its time of collection and its applicability.
5. Validity: The degree to which data conforms to defined formats, ranges, and types.
6. Uniqueness: The absence of duplicate records within a dataset.
Understanding these dimensions allows organizations to tailor their data quality measurements according to their operational needs and strategic goals. By establishing clear metrics, leaders can identify areas requiring improvement, thereby ensuring that their data remains a valuable asset rather than a liability.
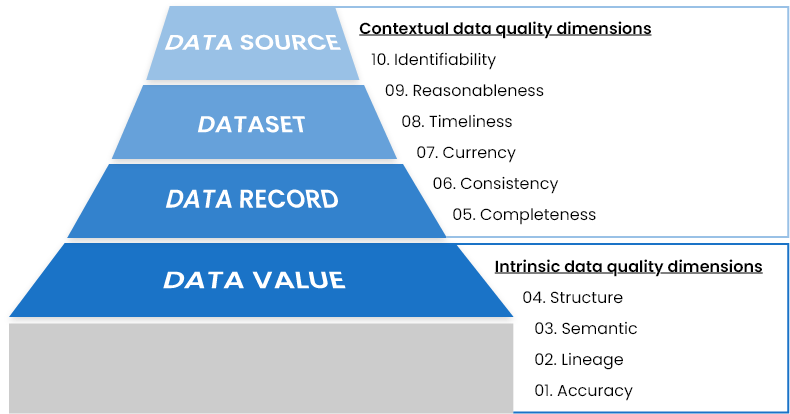
Data quality Dimensions Correspond to Data Hierarchy

Data hierarchy in any organization starts with a single data value. Values of various attributes for a specific entity or occurrence are grouped together to form a data record. Multiple data records (representing multiple occurrences of same type) make a dataset. These datasets can reside at any source or application to satisfy the needs of an organization.
Data quality dimensions behave and are measured differently at each level of data hierarchy. Technically speaking, all data quality metrics fall under two broad categories:
1. Intrinsic Characteristics: These metrics focus on the inherent attributes of the data itself, such as accuracy, completeness, and validity. They assess how well the data represents the truth and its quality independent of external factors.
2. Contextual Characteristics: These metrics consider the data’s relevance and applicability within its specific context, such as timeliness and consistency. They evaluate how the data meets the requirements of its intended use and its performance relative to other datasets.
The image below illustrates how data quality is assessed at each level of the data hierarchy and emphasizes the varying implications of data quality dimensions across different data types and structures.
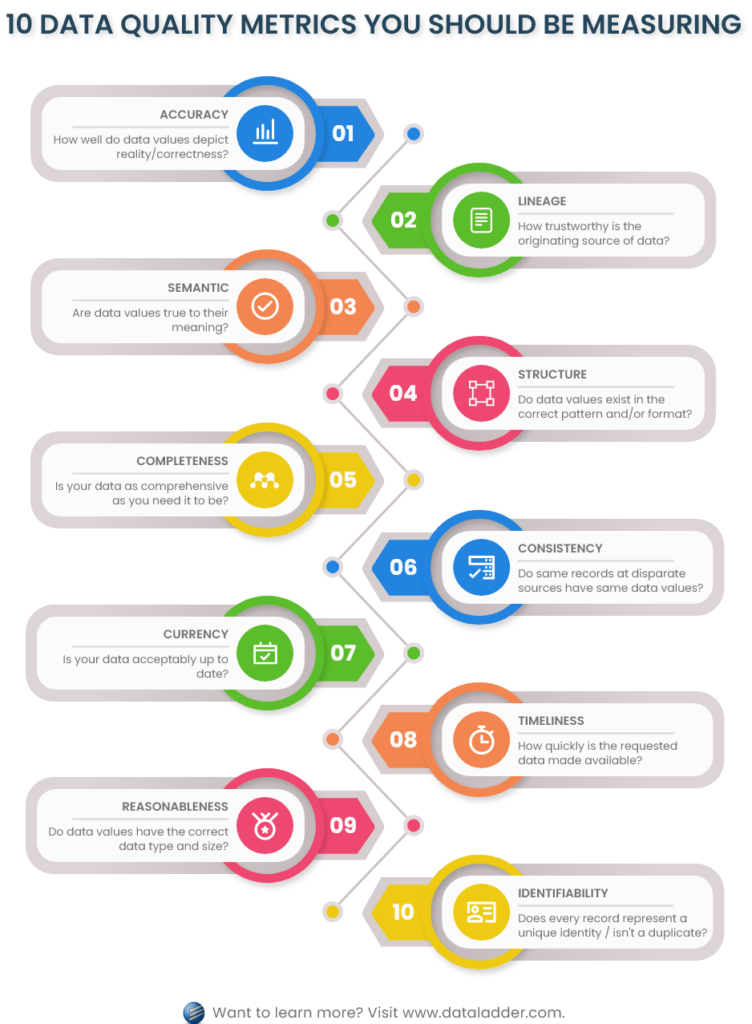
Top 10 Data Quality Metrics You Should Measure
Achieving a comprehensive data quality profile is crucial for any organization seeking to maximize the value of its data assets. Below, we explore ten key data quality metrics. Divided into two broad categories – intrinsic and contextual – they play a critical role in attaining a complete quality profile of your data.
A. Intrinsic Data Quality Dimensions
Intrinsic data quality dimensions directly assess and evaluate the data value – at the granular level – focusing on its meaning, availability, domain, structure, format, and metadata, etc. These dimensions do not consider the context in which the value was stored, such as its relationship with other attributes or the dataset it resides in.
Following four data quality dimensions fall under intrinsic category:
1. Accuracy
How well do data values depict reality or correctness?
Accuracy is the degree to which data values represent real-world entities. Measuring data accuracy involves verifying data values against a known (reliable) source of correct information. This measurement could be complex if there are multiple sources that contain the correct information. In such cases, you need to select the one that is the most inclusive to your domain, and compute the degree of agreeability of each data value against the source.
Data Quality Metrics Example: Measuring Accurate Data Values
Consider an employee database that contains the contact number of employees as an attribute. Accurate data would mean the phone number is the one that is correct and exists in reality. You can verify all phone numbers in your employee database by running them against an official database containing list of valid phone numbers.
2. Lineage
How trustworthy is the originating source of data values?
Data lineage refers to the validation of the data’s origin and all the sources that have contributed to or updated the information over time. This is an important measure as it proves the trustworthiness of the data captured, and as it evolves over time.
Understanding data lineage helps ensure that the data you use has come from reliable, authoritative sources.
Data Quality Metrics Example: Assessing Lineage of Data
Considering the same example discussed in the previous section, employee contact numbers are trustworthy if they came from a valid source. And the most valid source for this type of information is the employee themselves – whether the data is inputted the first time or updated over time. However, if the contact numbers were extracted from a public phone directory, this originating source (data lineage) is questionable and could potentially contain errors.
3. Semantic
Are data values true to their meaning?
To ensure high quality data, the data value must be semantically correct; which relates to its meaning – especially in context of the organization or department it is used. Information is usually exchanged between different departments and processes in an enterprise. In such cases, stakeholders and users of data must agree to the meaning of all attributes involved in the dataset, so that they can be semantically verified. Misunderstanding the semantic meaning of data can lead to misinterpretation and poor decision-making.
Data Quality Metrics Example: Semantically Correct Data Values
An employee database might have two attributes that store employee contact numbers: “Phone Number 1” and “Phone Number 2.” An agreed-upon definition might specify that “Phone Number 1” is employee’s personal cell number, while “Phone Number 2” is their residential telephone number.
It is important to note that the accuracy measure will validate the existence and realness of both these numbers, but the semantic measure will ensure that both these numbers are true to their implicit definition – meaning, the first one is a cell number, while the second one is a residential telephone number (landline). This alignment of meaning is essential to ensure correct communication and usage of the data.
4. Structure
Do data values exist in the correct pattern and/or format?
Structural analysis relates to verifying the representation of data values – meaning, the values have valid pattern and format. These checks are better made and enforced at data entry and capture, so that all incoming data is first validated and if needed, transformed as required, before storing in the application. This ensures that the data can be used effectively across various systems and minimizes the need for extensive data cleaning down the line.
Data Quality Metrics Example: Structurally Correct Data Values
Continuing with the employee database examples, all values in the column of “Phone Number 1” must follow a standardized structure or format. An example of poorly structured phone number could be “134556-7(9080.” Although, it is possible that the number itself (exclusive of the additional hyphen and parenthesis) is accurate as well as semantically correct. But the correct format and pattern of the number should be “+1-345-567-9080.”
Correct formatting ensures data consistency and reduces the chances of errors during integration of data into different systems or applications and thus, helps prevent/fix low quality data.
B. Contextual Data Quality Dimensions
These dimensions assess and evaluate data in their entire context, such as how individual values relate to each other within records or datasets. Contextual dimensions focus on the relationships between different data components, and their fitness to data quality expectations.
There are six data quality dimensions that fall under the contextual category. These include:
5. Completeness
Is your data as comprehensive as you need it to be?
Completeness refers to the degree to which the needed data values are filled and are not left blank. This can be calculated vertically (attribute-level) or horizontally (record-level). Usually, fields are marked mandatory/required to ensure completeness of a dataset. There are three different types of data values to consider while calculating completeness to ensure accuracy of the results:
· Required fields that cannot be left empty; for example, National ID of an employee.
· Optional fields that do not necessarily need to be filled; for example, hobbies field for an employee.
· Inapplicable fields that become irrelevant based on the context of the record, and should be left blank, for example, Spouse’s Name for an unmarried individual.
Data Quality Metrics Example: Complete Data
A vertical completeness check would assess what percentage of employee records have a value for “Phone Number 1.” And a horizontal completeness check would calculate the percentage of information that is complete for a particular employee. For instance, an employee’s data can be 80% complete, where his contact number and residential address is missing.
6. Consistency
Do disparate data stores have the same data values for the same records?
Consistency checks whether data values stored for the same record across disparate sources are free from contradiction and are exactly the same – in terms of meaning as well as structure and format.
Consistent data helps to perform uniform and accurate reporting across all functions and operations of your enterprise. Consistency does not only relate to the meanings of data values, but also, their representation. For instance, when values are not applicable or are unavailable, you must use consistent terms to represent the unavailability of data across all sources.
Data Quality Metrics Example: Consistent Data
Employee information is usually stored in HR management applications, but the database has to be shared or replicated for other departments as well, such as payroll or finances. To ensure consistency, all attributes stored across databases must have the same values. Differences, such as those in Bank Account Number, Social Security Number, or other such critical fields, could lead to significant problems.
7. Currency
Is your data acceptably up to date?
Currency relates to the degree to which data attributes are of the right age in context of their use. In other words, it reflects how recent and relevant your data is in relation to its intended use. This measure helps to keep the information up-to-date and in conformance with the current world, so that your snapshots of data are not weeks or months old, leading you to present and base critical decisions on outdated data.
To ensure currency of your dataset, you can set reminders to update data or set limits to an attribute’s age. This ensures that all values are reviewed and updated in a given time.
Data Quality Metrics Example – Current Data
Your employee’s contact information should be reviewed timely to check if anything was recently changed and needs to be updated in the system.
8. Timeliness
How quickly is the requested data made available?
Timeliness refers to the time it takes to access the requested information. If your queried data requests take too long to finish, it could mean that your data is not well-organized, related, structured, or formatted.
Data quality timeliness also measures how quickly is the new information available for use across all sources. If your enterprise employs complex and time-consuming processes to store incoming data, users can end up querying and using old information at some points.
Data Quality Metrics Example – Timeliness
To ensure timeliness, you can check the response time of your employee database. Moreover, you can also test how long it takes for the information updated in the HR application to be replicated in the payroll application, and so on.
In a well-functioning organization, if an employee’s information is updated in the HR system, that change should be reflected in other dependent systems, like payroll or benefits, without delay. A significant lag in data propagation between systems could result in inaccurate payroll or reporting, which can lead to compliance issues or employee dissatisfaction.
9. Reasonableness
Do data values have the correct data type and size?
Reasonableness measures the degree to which data values have a reasonable or understandable data type and size. For instance, it is common to store numbers in an alphanumeric string field, but reasonability will make sure that if an attribute only stores numbers, then it should be of number type.
Moreover, reasonability also enforces maximum and minimum character limit on attributes so that there are no unusually long strings in the database. The reasonability measure reduces space for data errors by enforcing constraints on an attribute’s data type and size. It helps improve data reliability, reduce storage inefficiencies, and minimize the risk of data corruption.
Data Quality Metrics Example – Reasonableness
In an employee database, the Phone Number 1 field – if stored without the hyphens and special characters – should be set to only numeric values and have a max character limit so that extra alphanumeric characters are not mistakenly added. Enforcing reasonableness ensures such fields maintain uniformity and are free of unnecessary characters.
10. Identifiability
Does every record represent a unique identity and is not a duplicate?
Identifiability calculates the degree to which data records are uniquely identifiable and are not duplicates of each other.
To ensure identifiability, a uniquely identifying attribute is stored in the database for each record. But in some cases, such as the case of healthcare organizations, personally identifiable information (PII) is removed to guard patient confidentiality. This is where you may need to perform fuzzy matching techniques to compare, match, and merge records.
Data Quality Metrics Example – Identifiable Data
An example of identifiability could be to enforce that every new record in the employee database must contain a unique Employee ID Number through which they will be identified.
How to build a unified, 360 customer view
Download this whitepaper to learn why it’s important to consolidate your customer data and how you can get a 360 view of your customers.
DownloadWhich Data Quality Dimensions to Use?

We have covered the ten most commonly used data quality metrics. However, considering that every enterprise has its own set of requirements and KPIs, you may need to use other metrics or create custom ones. The selection of right data quality metrics depends on multiple factors, such as the industry your business operates in, the nature of your data, and the role it plays in the success of your goals.
Since every industry has its own data rules, reporting mechanism, and measurement criteria, organizations adopt different set of data quality metrics to satisfy the needs of each case. For example, government agencies, finance and insurance departments, healthcare institutes, sales and marketing, retail, and educational systems each have unique data rules, reporting structures, and KPIs. As a result, the data quality dimensions that drive successful outcomes will vary across these sectors.
Automating Data Quality Measurement Using DataMatch Enterprise

Given the complexity of measuring data quality, this process is often seen as the responsibility of technical experts or data professionals. One major challenge that limits the ability of non-technical users to manage data quality effectively is the unavailability of advanced profiling features in many self-service data quality tools.
However, a self-service data quality management tool that can output quick 360-view of data and identify basic anomalies, such as blank values, field data types, recurring patterns, and other descriptive statistics can resolve the challenge. Data Ladder’s DataMatch Enterprise is one such data quality solution that does not only offer data quality assessment, but goes on to perform detailed data cleansing, matching, and merging.
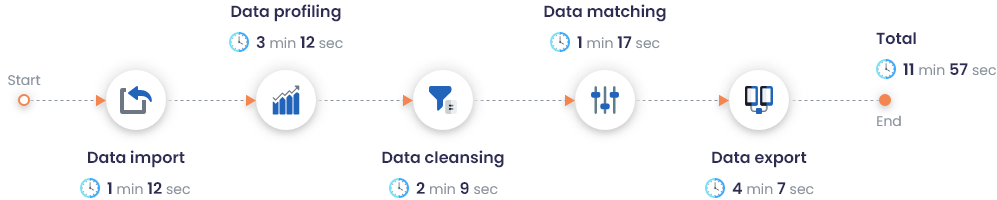
DME Performance on a Dataset of 2M Records
With DataMatch Enterprise, you can perform quick accuracy, completeness, and validation checks. Instead of manually identifying and marking discrepancies present in your dataset, with DME, your data team can single-handedly generate a report that labels and numbers various data quality metrics in just a few seconds – even with a sample size as big as 2 million records.
Here’s a screenshot of DataMatch Enterprise’s performance on a dataset containing 2M records:
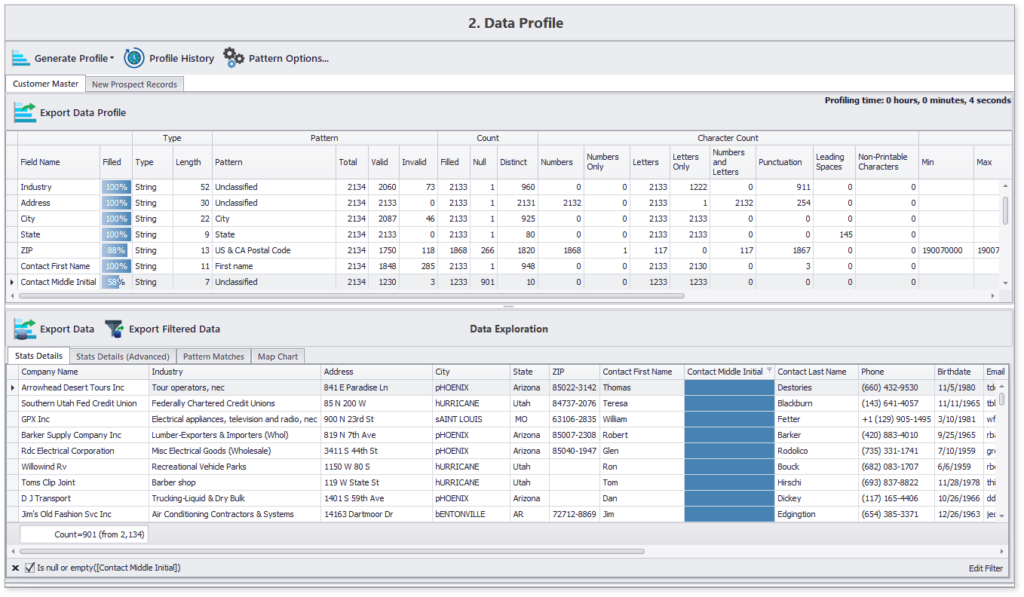
Detailed Data Quality Profile Generation and Filtering
Here’s a sample data profile generated using DME for approximately 2,000 records in less than 10 seconds:
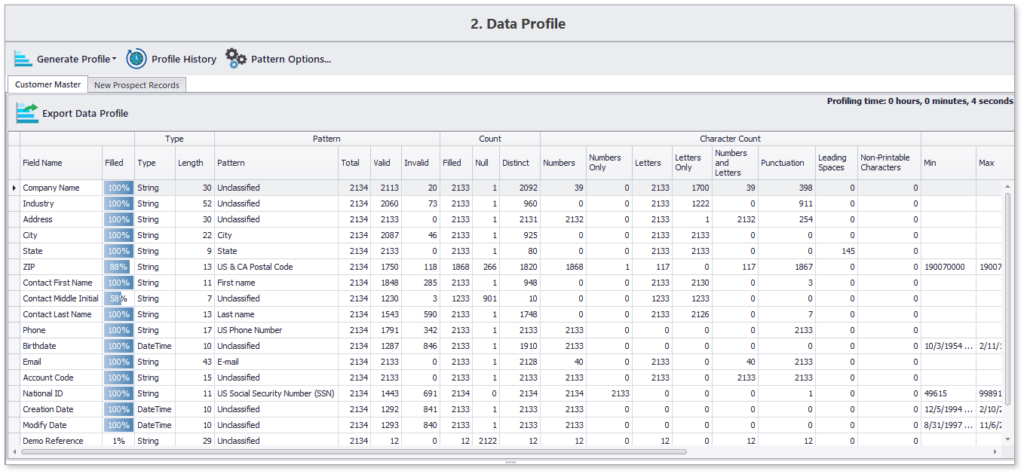
This concise data profile highlights content and structure details of all chosen data attributes. Moreover, you can also navigate to specifics, such as the list of those 12% records which are missing the contact’s middle name.
Getting Started with DataMatch Enterprise
Download this guide to find out the vast library of features that DME offers and how you can achieve optimal results and get the most out of your data with DataMatch Enterprise.
DownloadTake Action with DataMatch Enterprise
To know more about how our solution can help solve your data quality problems, sign up for a free trial today or set up a demo with one of our experts.