


Last Updated on December 10, 2025
Research shows that businesses can lose up to $3 of every $10 of revenue due to poor data quality. With incomplete data known to be a significant contributor to this problem, the cost of missing information can be very high. It can lead to flawed reports and skewed conclusions in the research sector and poor customer insights, inaccurate business intelligence, misguided decisions, and ultimately, a loss of ROI for businesses.
Addressing data completeness is essential for improving decision-making and protecting your bottom line. By effectively identifying missing data and correcting, organizations can improve data accuracy, ensure validity, and avoid costly errors that compromise insights and profitability.
What Does it Mean for Data to be Missing?
Missing data refers to gaps or blank values in datasets, where critical information is either null, incomplete, or entirely absent. These gaps can occur in any data environment, be it customer relationship management (CRM) systems, business intelligence tools, or research datasets.
Examples:
- Missing last names, phone numbers, email addresses in a CRM
- Missing age and employment years in an observational data set
- Missing income figures of employees in organizational data

What are the Causes of Missing Data?
The causes of missing data are numerous, but they can be summarized into the following four common reasons:
- Reluctance to Share Information: In surveys and forms, participants often refuse to provide sensitive information (such as income or demographic details like sexual orientation, creating gaps in data.
- Data Entry Errors and Poor Standards: Web forms or data entry systems that lack strict requirements (e.g., mandatory fields) allow users to submit incomplete data and thus, can lead to inconsistencies.
- Irrelevant Fields: Sometimes, certain data fields are not relevant to the target audience. For instance, a column requiring company name will be left empty if the majority of respondents are retired or unemployed.
- Participant Attrition: In research settings, particularly longitudinal studies, participant attrition (i.e., subjects dropping out of the study over time) is also a leading cause of missing data. This can affect the reliability of long-term research findings, complicating efforts to draw accurate conclusions.

Types of Missing Data:
In statistical research, missing data is categorized into several types. Understanding these types helps in selecting the appropriate methods for addressing missing data as well as improving the overall quality of your datasets. Below are the four main types of missing data:
Structural:
Structural missing data refers to data that is missing because it should not logically exist in the given context.
For Example:
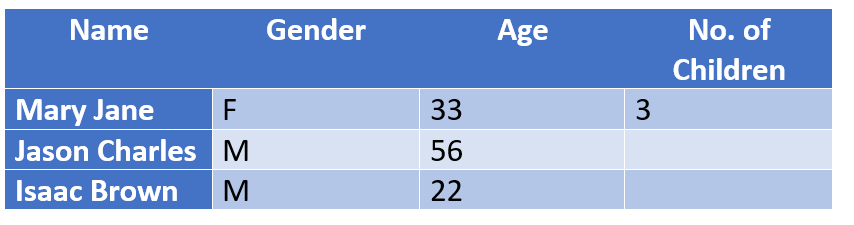
In a dataset of individuals with children, the “No. of Children” column will naturally be empty for individuals who do not have children. These people can be structurally excluded from the conclusion without impacting the outcome of a study because logically, they don’t need to fill that field.
Missing Completely at Random (MCAR):
MCAR occurs when the probability of missing data on a variable is unrelated to the values of that variable or any other variables in the datasets. In other words, the columns with missing data do not have an interdependency. The missing data is completely random and does not introduce bias.
For Example:
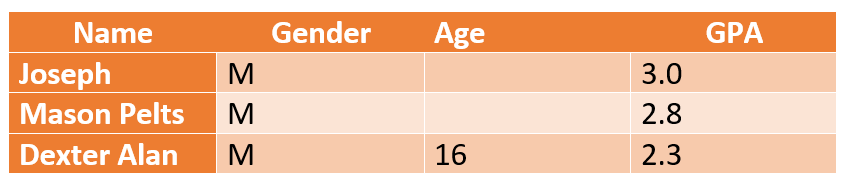
In a study measuring K-12 students’ academic performance, missing age values are not related to the students’ GPA scores. The missing age data can be imputed with a median age (for example, 16 to 18 for K-12 students) and move on with concluding the report without affecting its credibility.
Missing at Random (MAR):
As opposed to MCAR, where there is no connection between missing values and the study subject, MAR occurs when the likelihood of missing data on a variable is related to other observed variables but not to the missing data values themselves.
MAR allows us to predict patterns by using other information available about the person in the dataset.
For Example:
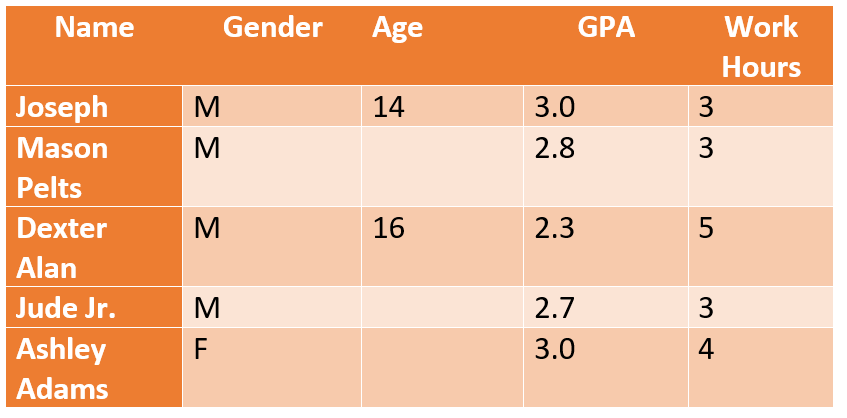
In a study where age is not related to students’ GPA scores, but it does impact their employment status, researchers can conclude that students above a certain age (14 in the above chart) may have lower academic scores due to part-time jobs affecting their study hours and mental capacity.
Missing Not at Random (MNAR):
Slightly confusing, MNAR refers to data that is purposefully missing – meaning, people refusing to answer.
For instance, in the study above, most 14-year-olds *may* refuse to fill their actual work hours. MNAR data is highly problematic because you can’t conclude or assume a specific reason and neither can you use standard missing data handling methods to extract a conclusive answer.
In the business world, the nature of missing or incomplete data is different. While you don’t have to deal with MAR, MNAR issues, you do have to deal with missing contact information (phone numbers, last names, emails, addresses, Zip codes etc.).
In statistical research models, researchers must identify the type of missing data in their datasets before attempting to address them.
Note: For those interested in a deeper understanding of the types of missing data in healthcare research and longitudinal studies, the article, ‘Strategies for handling missing data in longitudinal studies,’ by the Journal of Statistical Computation and Simulation is a great resource to dig into.
How is Missing Data Identified?
Researchers working with statistical programs like SAS, SPSS, Stata rely on manual statistical procedures to identify, delete, and replace missing values. But there’s a problem.
Most of these programs automatically remove missing values from any analysis you run. As a result, researchers may unknowingly work with incomplete datasets, where different variables show varying amounts of missing data.
Therefore, researchers have to check a data set for missing values before analysis to determine what to remove. This process is manual and demands specific platform knowledge in addition to mastering Python – the language used to code algorithms to detect missing data.
Figuring out missing data is just the first step of the problem. You will have to perform additional coding to replace missing values with imputations (that is using mean, median to replace missing values). This process can be time-consuming as it requires researchers to manually match columns, write codes, and keep reiterating the process until the desired outcome is reached. In an age when speed is the norm, you cannot afford to spend months identifying missing values and resolving them. It can delay insights and decision-making.
The challenge extends beyond academic research into business environments. CRMs were meant to lighten the data management burden, but they often fall short in managing missing data. As a result, businesses have to manually identify missing values and clean them by exporting the data to an XLS format to make bulk changes. While simple gaps in contact information like email addresses or phone numbers can be easily fixed using Excel, things get more complicated when the missing data involves more detailed information, such as firmographic (company details) or psychographic (customer behavior) data.
For example, identifying inconsistences like incomplete company names (such as BOSE [a brand] vs BOSE Corporation [a company]) is not so easy to handle manually! It’s a real challenge to resolve these gaps efficiently and ensure the completeness of such datasets without sacrificing valuable time.
Even more challenging is to limit missing data problems and ensure data completeness!
How to build a unified, 360 customer view
Download this whitepaper to learn why it’s important to consolidate your customer data and how you can get a 360 view of your customers.
DownloadWhat is Data Completeness and How Do You Measure It?
In the data quality framework, data completeness refers to the degree to which all data in a dataset is available. In simple terms, it’s a measure of how much of the expected information is available versus how much is missing. One straightforward way to quantify data completeness is by calculating the percentage of missing data entries. For example, a column of 500 records with 100 missing fields has a completeness degree of 80%.
While this percentage gives a quick snapshot of your data’s health, it’s important to understand the impact that incomplete data can have on business outcomes. A 20% deficit in data completeness might seem small, but in practice, it could result in lost opportunities, missed leads, and potentially hundreds of thousands of dollars in revenue slipping through the cracks, depending on the scale of your operations.
That said, achieving 100% data completeness isn’t always the goal, nor is it always necessary. The critical question isn’t whether every field is filled but whether the fields that matter are complete. For instance, while you would definitely need phone numbers (missing phone numbers could significantly hinder sales outreach), you may not need fax numbers (missing fax numbers might have little to no impact on business outcomes).
It’s also important to understand that data completeness doesn’t just indicate the level of information and knowledge you have about your customer and how accurate this information is, it’s also about understanding the context of the missing information. For example, in contact data, children and the elderly may not have email addresses or some contacts may not have landline or work phone numbers altogether.
Data completeness, therefore, does not imply that all data attributes must be present or populated. Rather, it requires you to classify and choose which data sets are important to keep and which can be ignored based on your business goals.
To sum up, effective measurement of data completeness involves determining the critical fields necessary to achieve desired outcomes and focusing on effort on ensuring the accuracy and availability of that key information.

How is Data Completeness Evaluated?
Traditionally, in the data warehouse, data completeness is evaluated through ETL (Extract, Transform, Load) testing that uses aggregate functions like sum, max, min, and count to assess the completeness of individual columns or records. These functions help calculate the average completeness of a dataset by identifying missing values in key fields.
In addition to aggregate functions, data profiling is also a crucial step in the evaluation of data completeness. Profiling involves examining the data to understand its structure, patterns, and quality issues. One method of doing that is through manual instructions using commands like:
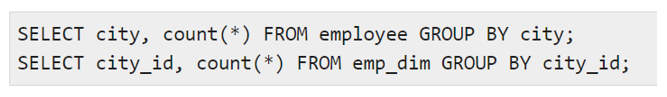
to compare distinct values and the count of rows for each distinct value, which can highlight gaps or inconsistencies. However, before running these commands, it’s essential for user to determine the type of incompleteness they are dealing with and establish the kind of data quality problem affecting the data, as different problems require different solutions.
For instance:
- If all phone numbers in your CRM are missing city codes, it might be a data quality problem at the entry level.
- If over 50% of the respondents did not provide an answer to a particular question, it might be a MNAR (Missing Not at Random) problem.
All this is great. But there’s an important step that people often overlook in the process: understanding the scope of missing data and deciding what percentage of incompleteness is tolerable.
You cannot clean, remove or replace missing values if you don’t know what’s missing and have established thresholds for acceptable levels of missing data.
This is done via data profiling!
Data Profiling – The First Step in Checking for Data Completeness & Identifying Missing Values at Attribute Level
Data profiling is the process of evaluating your data set to identify a range of data quality issues including:
- Missing values and records
- Data entry errors such as typos
- Attribute-level anomalies like use of punctuation marks or negative spaces in fields
- Standardization problems, such as inconsistency in formats (NYC vs. New York)
and more.
The goal of data profiling is to ensure that datasets are accurate, complete, and consistent, making it a foundational step in data quality management. But it’s not an easy. We will discuss that in detail later in the section. First, let’s quickly talk about why it’s so important.

Why Is Data Profiling Critical in Evaluating Data Completeness?
Without data profiling, missing values or inconsistencies often go unnoticed until they create bigger issues, such as flawed reports, skewed analysis, or erroneous decision-making. For example, if an email address field in your CRM has special characters due to data entry errors, email marketing efforts could suffer drastically as invalid addresses reduce open rates and conversions.
The Complexity of Data Profiling
Ideally, you want to be able to take a glance at customer data and easily or quickly identify the null values in the data. However, in reality, data profiling is an exhaustive task and can also be very time-consuming, especially when you’re dealing large datasets. While one could manually review each column of data independently, the sheet volume of information in large datasets makes this approach impractical for many organizations.
Python and other programming languages can automate some aspects of data profiling, such as sorting and filtering data, identifying null values, and running algorithms to detect patterns.
Python empowers the user to sort their data based on their perception and understanding. While this is ideal in terms of control and customization, it is not ideal if you’re pressed for time and accuracy.
You will need to consistently create and review codes. You will have to keep testing, measuring and analyzing results. Not only is this counter-productive, it beats the purpose of using data to achieve real-time goals.
For example, in the case of customer data, Python could be used to identify and correct fields like missing ZIP codes or inconsistent date formats (MM/DD/YYYY vs. DD/MM/YYYY). However, manual coding demands constant updates, testing, and analysis, which can slow down the process and may even lead to inconsistencies in results.
The Business Impact of Slow Data Profiling
Delays in data profiling and cleaning can severely impact your organization.
Can your marketing teams wait 4 months for you to clean, dedupe and consolidate customer data from multiple sources?
Can your organization afford to lose ROI with every passing day that results in ROI loss?
Not really.
If your marketing team has to wait months for accurate, deduplicated customer data, they miss opportunities for timely outreach, which leads to lost leads and decreased ROI. Similarly, every day that your datasets remain incomplete or inconsistent is another day where poor data quality directly affects your business operations, decisions, and profitability.
10 things to check when profiling your data
Data profiling is a crucial part of data conversion, migration and data quality projects. Download this whitepaper and find out the ten things to check when profiling your data.
DownloadSpeed and Accuracy Are Crucial
Given the competitive nature of business today, you can’t afford to spend months cleaning and organizing data as operational needs and market demands may evolve during this time. Automating data profiling using dedicated tools or software that integrate with your CRM or data warehouse is key to reducing time and improving accuracy. It will also offer real-time data insights and speed up decision-making.

Using an ML-Based Solution like DataMatch Enterprise vs Python Scripting or ETL Tools
People often prefer python scripting and ETL tools because they provide control and flexibility for managing data. However, they often require substantial time and coding experience to implement effectively. In contrast, machine learning (ML)-enabled solutions like DataMatch Enterprise (DME) automate the process and speed up data profiling to ensure data completeness without sacrificing control.
How Does DataMatch Enterprise Enhance Data Profiling?
DME, a data quality management tool from Data Ladder, allows you to identify missing values and incomplete information without the need for codes or scripts.
With DME’s data profiling function, you can check the percentage of data completeness at attribute level, something that can be challenging to achieve with traditional ETL tools or Python coding.
For example, if 30 out of 100 records in a dataset have missing values, DME automatically highlights these gaps for you to review. Additionally, the tool gives a health score to each column based on its completeness. If your “Last Name” column has a health score of 70%, the system flags it for further inspection. All this is done within just 10 minutes, saving you hours (if not days) of manual reviews, algorithms testing, and writing/rewriting of definitions to just check your data for accuracy or completeness.

That’s not all.
Sometimes you also need to consolidate data and deduplicate redundant data. For instance, if your customer’s information is stored in two separate data sources, with one source containing everything you need – phone numbers, email addresses, location etc., and the other source containing information you don’t necessarily need – age, gender, fax numbers etc., imagine the time and the processes you’ll have to go through to combine or merge or purge this information to ensure completeness. The mere thought is exhausting.
With a tool like DME you can match and dedupe a million records within 20 minutes!
Why USE DME Over Python or ETL Tools for Data Completeness?
Python and ETL tools are excellent for customization. However, they become cumbersome for large-scale operations or urgent deadlines. A tool like DME allows to leverage machine learning for tasks such as:
- Records matching
- Data deduplication
- Identifying and fixing incomplete or missing information
- A comprehensive health check of your data
The key advantage is the automation of repetitive tasks, which frees up your data team to focus on higher-level analysis and strategy, rather than the mechanics of data cleaning.
Getting Started with DataMatch Enterprise
Download this guide to find out the vast library of features that DME offers and how you can achieve optimal results and get the most out of your data with DataMatch Enterprise.
DownloadThe True Goal of Data Completeness
It’s easy to overlook missing values and proceed to compiling reports or performing activities, even while knowing that you have incomplete data. But doing so often results in serious consequences. For example, an email marketing campaign that disregards missing last names may have to struggle with duplicate records and eventually, might suffer from low engagement and credibility issues. Similarly, a report that relies on incomplete dataset can draw misleading conclusions, which can potentially affect corporate policies, critical decisions about reforms, or even business strategies.
The cost of ignoring data (in)completeness can be high. Business plans built on incomplete or inaccurate data can fail, and in some cases, errors rooted in poor data quality can even lead to legal repercussions.
Achieving Purposeful Data Completeness
As mentioned earlier, the true goal of data completeness isn’t to have a perfect, 100% complete dataset. Instead, it is to ensure that the data needed to drive informed decisions is valid, complete, accurate and usable. This means prioritizing the fields and attributes that are essential to your specific purpose, while understanding that some data points may remain incomplete without impacting the overall outcome.
Drawing from an example discussed earlier, phone numbers may be crucial for customer service teams, but fax numbers might be unnecessary. Similarly, in financial reports, some missing demographic information could be acceptable if the focus is on transaction history and behavioral trends.
Using Technology for Data Completeness
Tools like DataMatch Enterprise (DME) can help you reach this goal efficiently. DME automates data profiling and the identification of missing values, allowing you to focus on what really matters: using complete, accurate data to enhance business outcomes. With the right technology in place, you can avoid the pitfalls of working with incomplete datasets and ensure that your decisions are based on reliable information.
Download a free trial today or book a free demo with one of our experts to learn more about DME’s comprehensive data management solutions.