


Last Updated on November 27, 2024
In March 2017, Rescue 116, a CHC Ireland helicopter, crashed into a 282ft obstacle – the Blackrock Island off the County Mayo coast. Investigations revealed that the helicopter operator lacked a “formalized, standardized, controlled, or periodic” system due to which, the database used by the operator to review flight routes was missing details about the Blackrock Island. It was reported that the crew received no warning of this massive obstacle in their flight route until they were just 13 seconds away from it. The worst part is that a complaint about this inaccuracy in the Irish Coast Guard database had been logged four years prior to the incident, but no corrective measures were taken.
In a world where every action is data-driven (whether this fact is officially recognized or not), such incidents prove that the cost of poor data quality is often highly underestimated – until, of course, the disaster strikes.
It’s important to note here that the biggest challenge is not data quality assessment itself; it’s the lack of quick and timely data quality measures that can alert stakeholders whenever the quality of their data goes below an acceptable threshold, before the consequences become irreversible.
Ten Dimensions of Data Quality Assessment
At its core, data quality ensures that data can be used for its intended purpose without running into any errors. But measuring data quality can often be tricky as there’s no one-size-fits-all process for it. Data quality measurement involves evaluating multiple dimensions that collectively determine its reliability. Here are ten critical data quality dimensions widely recognized as the foundation for this assessment:
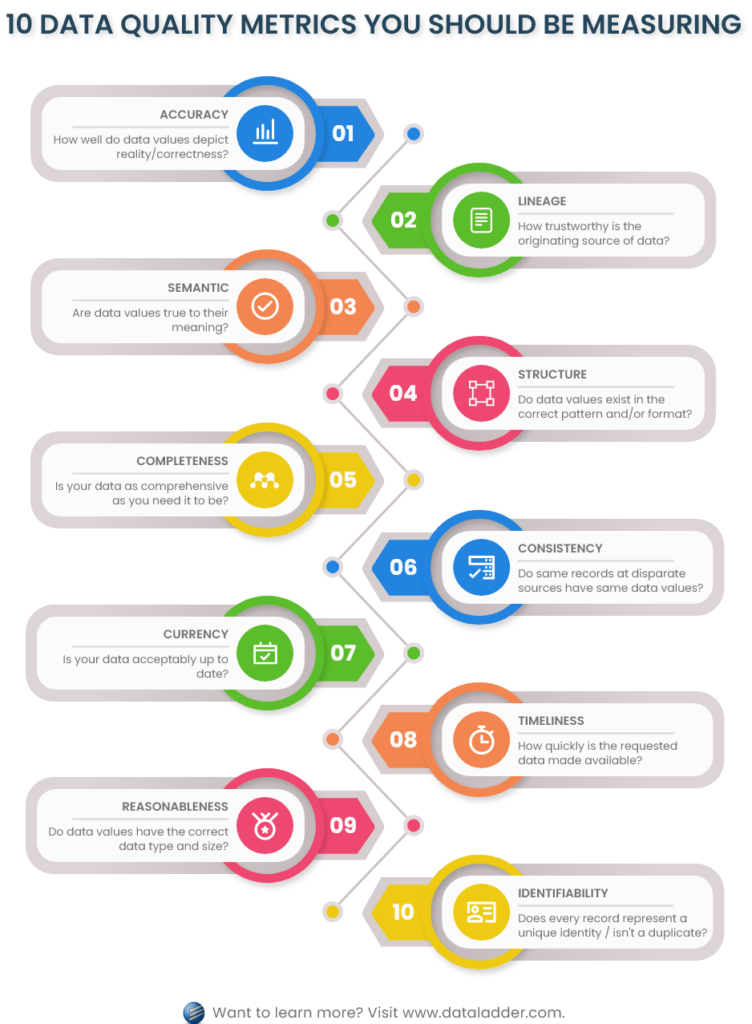
The challenge, however, lies in how quickly can these dimensions be measured, to what level, and to what degree can the results highlight actionable insights, so that teams can be alerted in time about data quality deterioration and its impact on data operation costs.
Friday Afternoon Measurement (FAM) – A Quick Data Quality Assessment Method
As mentioned above, data quality issues are often difficult to detect until they have already caused significant damage. To proactively address this challenge, Tom Redman proposed the Friday Afternoon Measurement (FAM) method – a straightforward yet powerful approach that addresses the question: Do I need to worry about data quality?
FAM provides a quick and effective data quality evaluation method that can be completed in about an hour on a Friday afternoon when the pace of work has slowed down – hence, its name. This method allows teams to assess data quality on a weekly basis and identify and address red flags before issues escalate.
How the FAM Method Works?
Here’s how you can measure data quality using the FAM method:
Step 1: Assemble recent data
Begin by collecting a representative sample of data from the most recent data-related activities in your department.
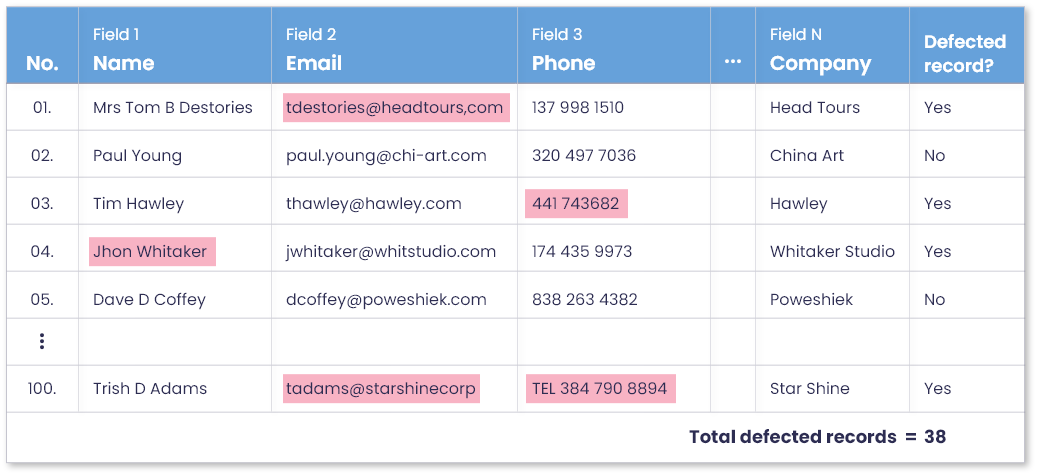
For example, for the sales department, this can be the last 100 record entries in their CRM. Here, you can either use the data that was recently created or recently used. Once you have those 100 records, select 10-15 data elements or attributes – basically, the information about those records that is most important or relevant to operations. This could be customer names, email addresses, transaction dates, etc.
Step 2: Identify defected and defect-free records
Bring together 2-3 team members familiar with the data for a brief meeting. Together, review the selected records and their attributes, and mark all data values with quality errors. These may include:
- Missing or null values
- Invalid formats or entries
- Misspellings or inconsistencies
Mark each record as either perfect or defective. When you have marked all records, add a new column in the sample dataset labeled ‘Perfect record,’ and fill the column values depending on whether an error was encountered for a record or no. In the end, you can add and calculate the number of defected and defect-free records marked in the sample dataset.
This activity usually doesn’t take that long, since data quality errors will be mostly obvious. But there could be a small number of records that require deeper discussions between the team members to analyze data quality problems.
Step 3: Calculate the percentage of data quality
Once errors are marked, it’s time to put things in perspective and gain conclusive results. Let’s say, out of the last 100 records your team created or used, only 62 proved to be completely perfect, while the rest of 38 had one or more data quality errors. A 38% error rate in recently collected/used dataset raises a red flag and confirms that your department has a data quality problem that demands immediate attention.
Step 4: Quantify the cost of poor data quality with the rule of ten (RoT)
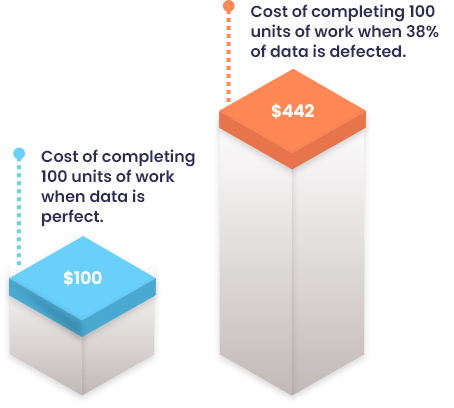
The FAM method doesn’t end with calculating the percentage of data errors. It goes on to calculate an estimated cost of poor quality data so that your team and C-level executives can also understand the financial impact of bad data. This cost calculation requires applying the Rule of Ten, which says that “it costs ten times more to complete a unit of work when the data is defected, as compared to when it is perfect.”
For example, if the cost of a single unit of work is $1 when the data is perfect, the cost of it with defected data would be $10. The total cost for 100 records, as discussed in the example above, can be calculated as:
Total Cost = (62 x $1) + (38 x $10) = $62 + $380 = $442
This calculation shows how defected data records cost you about four times more, compared to if the data was perfect. Now that you know you have a data quality problem and the cost of its impact, you can realize the urgency of addressing it and take prompt corrective measures to fix these errors.
Why FAM Matters
The FAM method empowers organizations to:
- Proactively detect and address data quality issues
- Quantify the business impact of poor data
- Build a case for prioritizing investments in data quality improvement and management tools
By implementing FAM, teams can raise awareness and take corrective actions before bad data affects operations, revenue, or customer trust.
Implementing FAM with DataMatch Enterprise – Accelerate Data Quality Assessments with the Best-In-Class Data Quality Software
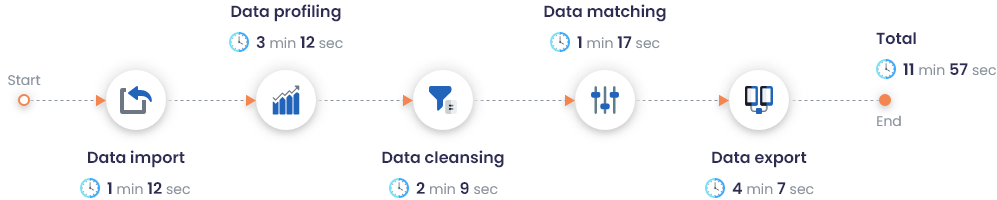
While the Friday Afternoon Measurement (FAM) method is highly effective, quick, and cost-efficient, it can be time-intensive for teams dealing with large data sets. With the right tools, this process can be further streamlined dramatically – reducing the time required from 2 hours to as little as 3 to 5 minutes, with only one team member involved with the right self-service data quality tool.
DataMatch Enterprise (DME) is a best-in-class data quality management software that can automate and enhance the FAM process. It employs a variety of statistical algorithms to enable businesses to asses, profile, clean, match, and dedupe their data at scale.
How DataMatch Enterprise Elevates FAM
Here are some ways DME can elevate your data quality measurement process with FAM:
1. Instant data profiling and quality insights
DME offers comprehensive profiling capabilities to quickly assess your data and generate instant 360-reports highlighting:
- Blank or null values
- Invalid data formats and patterns
- Incorrect data types
- Outliers and other key descriptive statistics
For instance, instead of having you manually combing through 100 sample records, DME can instantly analyze and profile datasets as large as 2 million records in seconds and thus, helps you save valuable time and resources.
2. Automatic labelling of perfect and imperfect records in a matter of seconds
With DME, your team can skip the manual marking of defective records in your data sets. The tool applies advanced algorithms to automatically identify and label perfect and imperfect records – that too, in seconds. This eliminates the risk of human error and ensures accuracy even with large-scale datasets.
Example:
Here’s a preview of DataMatch Enterprise’s performance on a dataset containing 2M records:
3. Quick detailed data quality profile generation and filtering
DME allows you to generate concise yet detailed data profiles in no time.
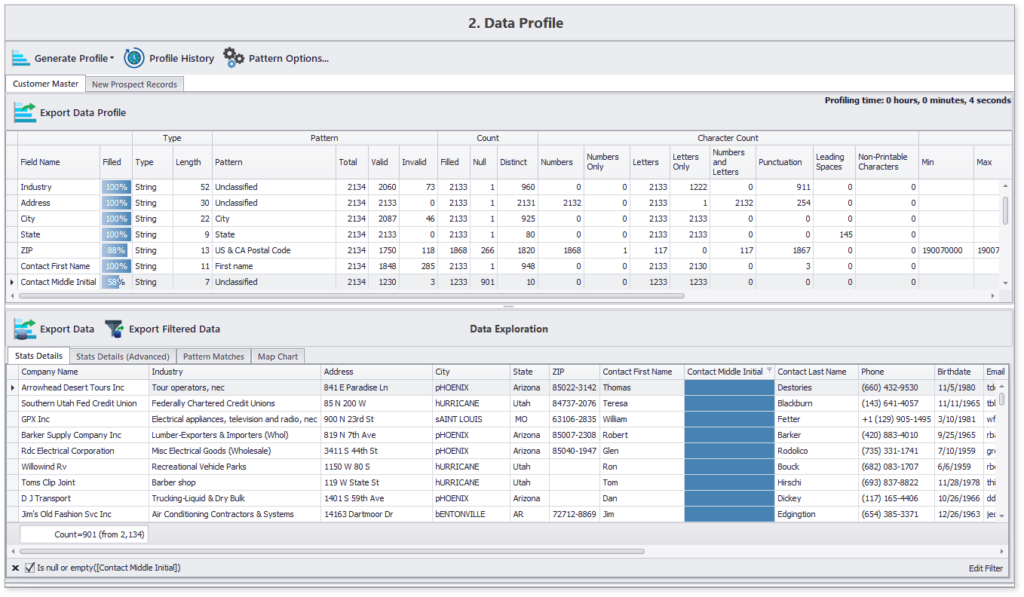
Here’s a sample profile generated using DME in less than 10 seconds for about 2000 records:
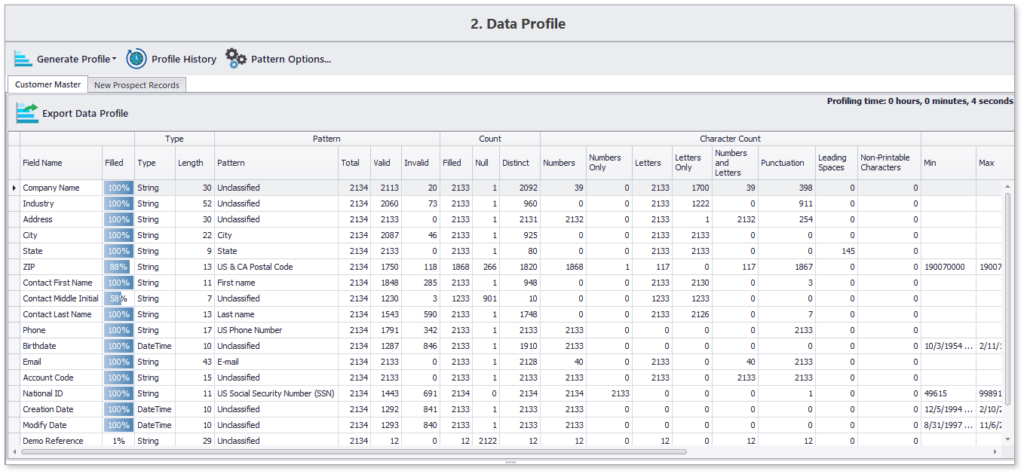
This concise data profile highlights content and structure details of all chosen data attributes. Moreover, you can also navigate to specifics, such as the list of those 12% records which are missing the contact’s middle name.
Why Choose DataMatch Enterprise for FAM?
DataMatch Enterprise offers:
- Speed and Scalability: Analyze massive datasets in minutes and free up your team for higher-value tasks.
- Self-Service Accessibility: Designed for business users, DME empowers non-technical team members to perform data quality assessments without relying on IT support.
- Cost Efficiency: By automating labor-intensive processes, DME helps reduce operational costs associated with poor data quality.
- Accurate Decision-Making: With up-to-date and actionable insights, businesses can proactively fix data quality issues before they affect performance.
Simply put, by integrating FAM with DataMatch Enterprise, your organization can achieve:
- Faster, more accurate data quality assessments
- Reduced costs of poor data quality
- Improved operational efficiency and decision-making
Take advantage of the power of DataMatch Enterprise to simplify and supercharge your data quality processes – because when it comes to high quality data, every second counts.
What’s Next – From Data Quality Assessment to Data Quality Fixing
DataMatch Enterprise (DME) doesn’t just stop at data quality assessment; it also takes the next critical step and use the assessment results to fix data quality issues. Here’s how DME transforms raw, problematic datasets into reliable, actionable insights:
Advanced Data Cleansing and Standardization
DME uses a range of data cleansing and standardization techniques to automatically fix incomplete, invalid, or incorrectly formatted values.
Duplicate Detection with Exact and Fuzzy Matching
DataMatch Enterprise utilizes sophisticated data matching algorithms to identify and consolidate duplicate records, regardless of variations in data formatting or input errors using exact and fuzzy matching techniques. This eliminates inconsistencies and errors and ensures higher data accuracy, even at scale.
Rule-Based Deduplication for a Single Source of Truth
DME configures rules to select unique record in the group of duplicates identified. It intelligently selects the most accurate and complete record from duplicate groups to ensure only one authoritative record remains.
Data Standardization Across Columns
Seamlessly overwrite and standardize column values to create a unified, trustworthy dataset that serves as the single source of truth.
Effortless Integration and Data Management
One of DME’s standout features is its ability to integrate with virtually any data source. Whether you’re working with CRMs, ERPs, or legacy systems, DME can:
- Pull historical data records from specified dates.
- Push clean, standardized datasets back to their original source or other systems for ongoing operations.
All these features come together to make DataMatch Enterprise a one-stop data quality software that can be used in any department of any industry.
To know more details on how our solution can help implement the FAM method on your dataset, or solve your data quality problems, sign up for a free trial today or set up a demo with one of our experienced professionals.