



































Last Updated on October 8, 2026
An entity graph shows a single match group as a network, with each source record as a node and each match between two records as a link. It shows which records were grouped together, which sources they came from, and which records each one is linked to, before the group is merged into one golden record or loaded as one node in a knowledge graph.
That definition puts the weight on the matching decisions that sit underneath a knowledge graph. This guide covers how entity resolution turns raw records into entity graphs, where those groups can go wrong, and how the Entity Graph in DataMatch Enterprise lets you see and check each match group before it reaches a knowledge graph or AI pipeline.
How entity resolution builds a knowledge graph
An entity resolution knowledge graph is a graph in which each node represents one resolved real-world entity rather than one source record. Duplicate records collapse into a single node, the source records behind it can stay linked to it, and relationships that were scattered across the duplicates attach to the one resolved entity instead.
Entity resolution builds a knowledge graph in two passes. Matching compares records and scores how likely each pair is to describe the same entity. Grouping then follows the links between matched pairs to form clusters, picks a master record for each cluster, and publishes every cluster as one node in the knowledge graph.
In practice, the sequence runs like this:
- Profile each source to find blanks, placeholder values and inconsistent formats
- Cleanse and standardize names, addresses, phone numbers and dates
- Define how each field is compared (exact, fuzzy, phonetic or numeric) and how much it counts
- Score record pairs within each source and across sources
- Treat pairs above the match threshold as links between records
- Group linked records into clusters, one per real-world entity
- Select a master record and apply survivorship rules to build the golden record
- Export resolved entities, with source record IDs attached, to the knowledge graph or target system
Records become nodes and matches become links
The graph exists inside the matching engine before any graph database gets involved. Each source record is a node, and each pair that clears the threshold becomes a link between two nodes. Behind every link sits a set of field-level scores for name, address, email or phone, each compared with the method that suits that field.
Same-source and cross-source matches
Links come in two kinds, and they mean different things.
A same-source match connects two records inside one dataset, which tells you that system is letting duplicates in.
A cross-source match connects records from different datasets, such as a prospect list and a customer master, and those are the connections a knowledge graph exists to make.
Transitive matching forms the group
Records usually join a group through any chain of matches. If record A matches B, and B matches C, all three land in the same group, even when A and C were never a strong pair on their own. That’s what lets resolution assemble an entity across sources that share no common key.
The same mechanism explains how a single weak link can pull an unrelated record into a group. A pair can look reasonable in isolation while the group it creates does not, which makes the group, rather than the pair, the thing that needs checking before export.
From group to golden record
Once a group is confirmed, survivorship rules decide which values the resolved entity carries, such as the most recent address, the most complete company name, or the value from the most trusted source. In DataMatch Enterprise, this happens in Merge & Survivorship after match results have been reviewed. Keeping the source record IDs attached to the golden record is what lets anyone trace a knowledge graph node back to the records that produced it.
How entity graphs work in DataMatch Enterprise
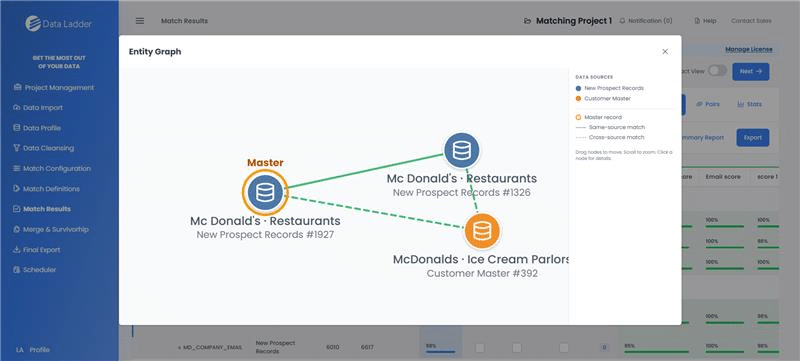
In DataMatch Enterprise, the Entity Graph shows a single match group as a network, with each record as a node and each match as a line between two nodes. It sits alongside the Match Results table and gives reviewers a way to see how a whole group fits together before it’s merged and exported.
Why a graph view sits next to the match table
Match Results in DME are shown as a table, one row per record, with matched records grouped together. That layout works well for checking individual pairs. It gets harder once a group holds three or more records from more than one source.
When a group has three or more records from more than one source, you have to read across rows and compare record IDs to work out which record matched which, and why they ended up in the same group.
The Entity Graph shows that same group as a picture, so the structure is visible at a glance.
Exploring a group
Three controls handle navigation. You can drag nodes to rearrange the layout, scroll to zoom in and out, and click any node to open that record’s details. For small and medium groups, every record and link stays easy to follow.
Very large groups behave like any network diagram, filling up with nodes and crossing lines until single links become hard to trace. Dragging nodes apart and zooming in helps. The graph is built for checking and explaining a group, though, and for groups with hundreds of records, the tabular Match Results remain the better place for detailed review.
The graph shows connections and the table shows scores
The graph tells you how records are connected. Line style shows whether each match is same-source or cross-source, and each node carries its source and record ID.
The scores behind each connection live in the Match Results table. That’s where you’ll find the field-level scores, such as the email score and the overall score, along with the match definition that produced the link. A typical review uses both views. You find a group or link worth checking in the graph, then look it up in the table to see the scores.
Spotting a bad link and fixing it
The Entity Graph is view-only. It shows the groups that matching produced, and it doesn’t let you remove a record, break a link or change a threshold from inside the view. Its job is to make questionable links obvious.
The group in the screenshot above shows what that looks like. Two restaurant listings from New Prospect Records connect to an ice cream parlor listing in Customer Master that has a very similar name. In a table, that record is one more row in the group. In the graph, it’s a separate node from a different source attached by dashed cross-source links, which makes it the obvious place to start checking.
Once a reviewer spots a link like that, the fix happens in DME’s normal workflow:
- Review or adjust the group in Match Results or Merge & Survivorship
- Tune the rules or thresholds in Match Configuration and Match Definitions, then run the match again
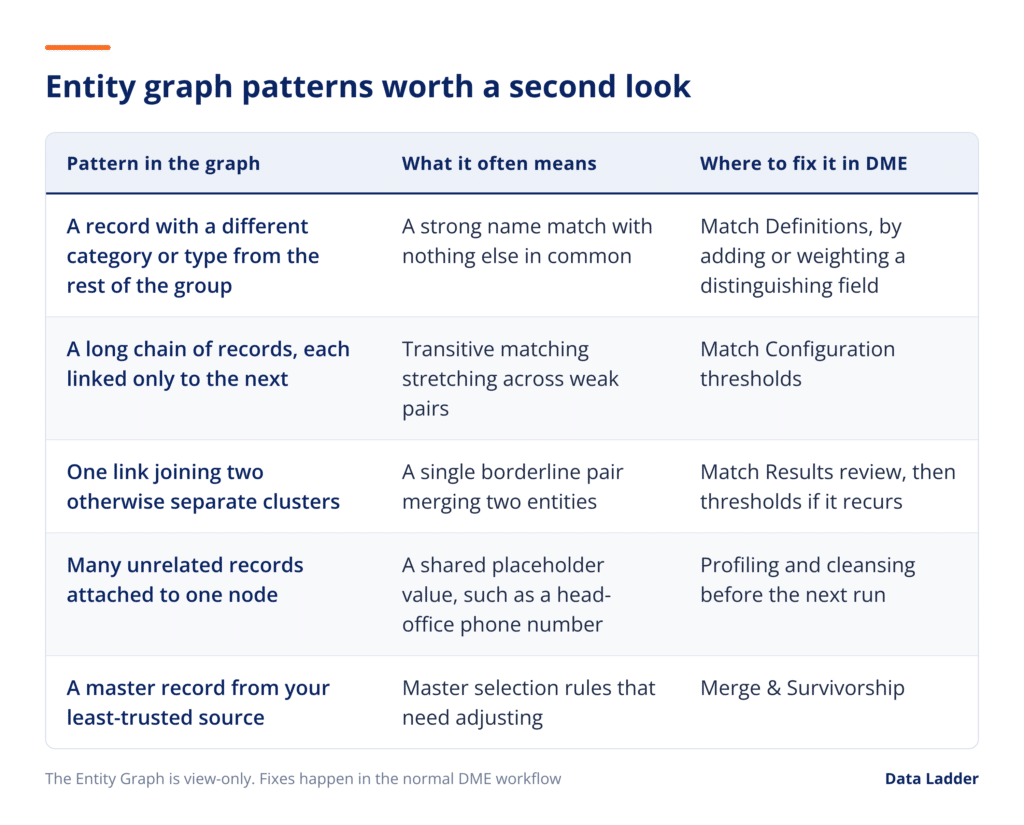
It helps to know which patterns deserve a second look. These are the ones that tend to point to a problem in any entity graph.
Why matching accuracy decides how much review you need
A graph view helps reviewers check groups, but nobody inspects every graph in a large run. In Data Ladder’s 10-million-record benchmark, DME produced 117,201 matched groups across 439,549 pairs in about 41 minutes. At that scale, the accuracy of the matching itself determines how many groups need a human look.
DME has recorded 99% matching accuracy and, across 15 comparative studies, found 5 to 12% more matches than other enterprise data quality platforms. For a knowledge graph, more correct matches means fewer fragmented entities, and high accuracy keeps the number of false merges small enough for the Entity Graph to catch the ones that remain. The latest release also includes rebuilt phonetic and numeric matching, which affects the comparisons behind every link a reviewer sees.
Why duplicate nodes do more damage in a graph than in a table
A duplicate row in a table inflates a count by one. A duplicate node in a graph splits an entity’s relationships across two or more nodes, so every measure that depends on connections, including degree, centrality, community membership and shortest paths, gets calculated on a partial view of that entity.
Split relationships hide how important an entity is
Graph algorithms read structure. When one supplier exists as three nodes, each node holds a share of its invoices, contracts and contacts. Centrality ranks the supplier lower than it should, and community detection can place the fragments in different communities altogether. Nothing in the graph flags the problem, because each fragment looks like a valid entity with fewer connections.
Over-merged nodes invent relationships
The opposite failure does more harm in fraud, KYC and investigations work. When two different people are merged into one node, the accounts, addresses and transactions of both now belong to a single entity. Paths appear between parties with no real connection, and a ring analysis built on that graph can pull unrelated customers into the same case. Fragmented nodes can be merged later. A false merge has to be found before anyone can undo it.
What this means for GraphRAG and AI agents
Knowledge graphs give language models structure that plain vector retrieval misses. In Microsoft Research’s GraphRAG study, graph-based approaches won between 72% and 83% of head-to-head comparisons on answer comprehensiveness against conventional vector RAG for corpus-wide questions. LinkedIn’s customer service team built a knowledge graph from historical support tickets, improved retrieval MRR by 77.6% over its baseline, and cut median per-issue resolution time by 28.6% after about six months in production.
Entity resolution is the step those results depend on. The GraphRAG paper’s own pipeline reconciled extracted entity names with exact string matching, and the authors argue the method tolerates duplicates because they tend to land in the same community for summarization. That holds for questions like “what are the main themes in this dataset.” It holds far less well when an agent needs one customer’s complete account history, or when the graph is built from CRM, ERP and claims records where the same entity carries a different ID, spelling and address in every source.
Graph databases store and traverse relationships well, and GraphRAG pipelines turn those relationships into context for a model. Neither can tell whether two nodes should have been one, or whether one node should have been two.
That judgment gets made in the matching step, where records are scored, grouped and merged. Groups are where errors hide, because a pair that looks reasonable can still produce a group that doesn’t. Seeing each group as a graph, with its master record, its sources and the type of every link visible together, makes those errors far easier to catch before they become nodes that analysts, investigators and AI agents depend on.
DataMatch Enterprise puts that review inside the same workflow as profiling, matching and survivorship. Start a free trial to run your own data through it and open the entity graph on your match groups, or talk to our team about a knowledge graph project you’re planning.
Frequently asked questions
These are the questions data teams raise most often when planning entity resolution for a knowledge graph.
Should entity resolution happen before or after loading data into a graph database?
Before, in most cases. Resolving first means the graph receives one node per entity, with lineage back to the source records, and graph algorithms run on accurate structure from the start. Resolving inside the graph is possible, but once relationships have attached to duplicate nodes, every merge means re-pointing those relationships, which is slower and easier to get wrong.
Can a graph database handle entity resolution on its own?
Graph databases are built to store and traverse relationships, and some teams write matching logic directly in a query language such as Cypher. The rest of the matching workflow, including standardization, per-field fuzzy and phonetic comparison, survivorship rules and human review, usually has to be built on top. Most production pipelines run a dedicated matching tool first and load its results.
How does transitive matching cause false merges?
If record A matches B and B matches C, all three usually land in one group, even when A and C clearly describe different entities. One borderline link can merge two real entities this way. The usual safeguards are tighter thresholds, match definitions that include a distinguishing field, and visual review of large or mixed-source groups.
Does GraphRAG need entity resolution?
For corpus-wide summary questions, GraphRAG can tolerate some duplicate entities, since its authors note duplicates tend to cluster together. For questions about a specific customer, supplier or patient, or for graphs built from structured records across several systems, it does. Without resolution, retrieval pulls a fragment of the entity and the model answers from incomplete context.
Can you edit match groups from the Entity Graph in DataMatch Enterprise?
No. The Entity Graph is view-only. Use it to find a questionable link, then adjust the group in Match Results or Merge & Survivorship, or tune the rules and thresholds in Match Configuration and Match Definitions and run the match again.