


Last Updated on October 3, 2024
Data is the lifeblood of decision-making in the business world today. Yet as revealed by the State of Data Quality Report 2022, less than half (49%) of data practitioners trust the quality of their data. Despite 91% of organizations acknowledging that poor data quality negatively impacts their operations, only 23% have made data quality a core part of their organizational ethos.
The cost of ignoring data quality issues is high – and it’s only getting worse. In 2023, businesses reported an average 31% revenue impact due to bad data, up from 26% the year before.
A well-designed data quality management framework is essential for overcoming these challenges. By implementing standardized metrics, automated data quality processes, and fostering a data-centric culture, organizations can improve data accuracy, restore trust, and ultimately protect their bottom line. A data quality framework doesn’t just streamline data processes; it also serves as a continuous data quality improvement plan and safeguards the very foundation of business success.
What Is a Data Quality Framework?

A data quality framework, also known as data quality lifecycle, is a systematic process that monitors the current state of data quality and ensures that it is maintained above defined thresholds. Usually designed as a continuous cycle, this framework ensures that data quality is regularly assessed, and errors are corrected systematically in time.
Example of a Data Quality Framework
Businesses looking to fix their data quality problems often adopt almost the same data quality processes. However, a data quality framework is where their approaches differ.
For example, a data quality management system will definitely use some basic data standardization techniques to achieve a consistent view across all data values. But the exact nature of these standardization techniques depends on the current state of the data and what the company wishes to achieve (business objectives).
To illustrate (and better understand) this, we will explore a comprehensive yet adaptable data quality framework process/design that can be adapted to suit any organization’s unique requirements.
The 4 Stages of Data Quality Management Framework
A simple data quality management framework or lifecycle typically consists of four stages, as outlined in the picture below:
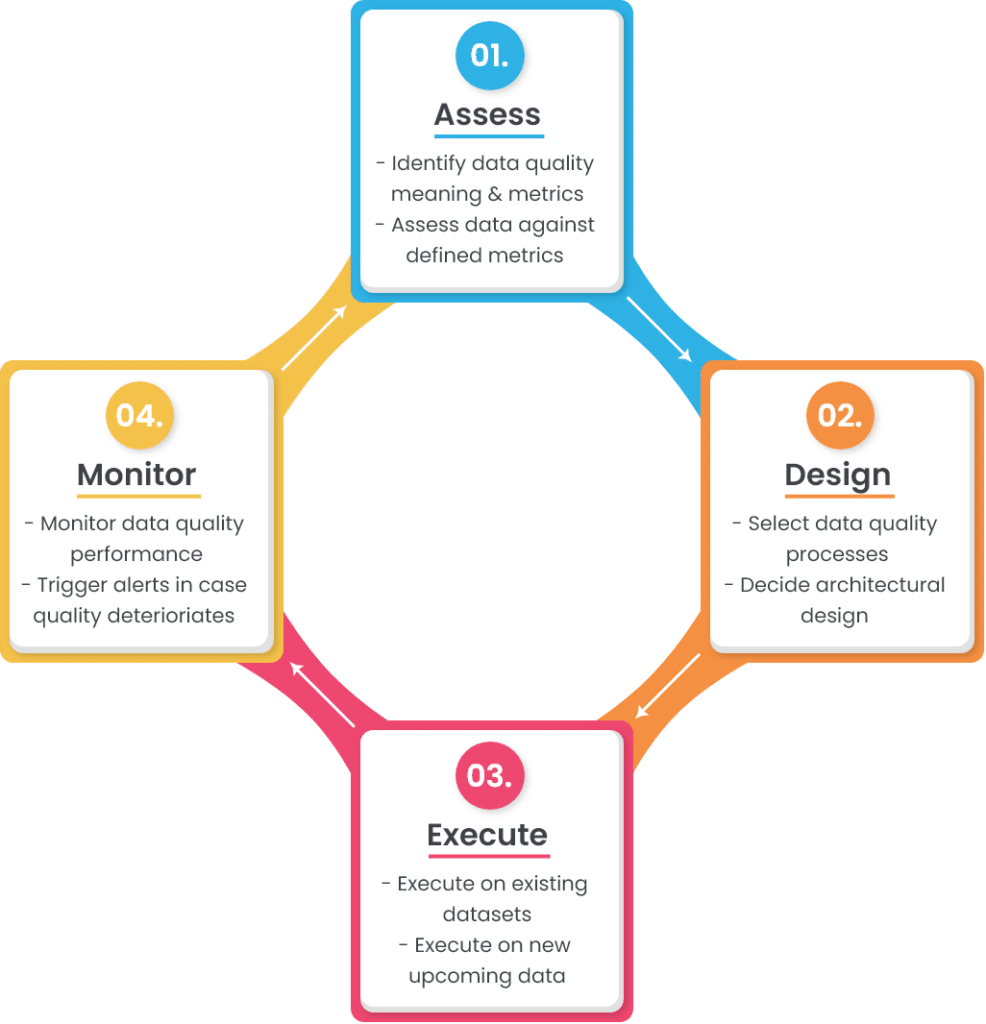
Let’s discuss each of these stages in more detail:
1. Assess
The first step of any data quality framework involves assessing two critical aspects:
- What data quality means for your business?
- How well your current data measures up to those expectations?

Identify the Meaning and Metrics of Data Quality
Data quality is defined as the degree to which the data fulfills its intended purpose. And to define what “good data” or “high data quality” means for your business, you need to identify the role it plays in different operations.
Let’s take a customer dataset as an example. Whether it is used for direct communication or to gain insights for business decision-making, the customer dataset must meet certain data quality rules.
To define “good quality customer data,” you have to do the following:
- Identify the sources where customer data comes from (web forms, third-party vendors, customers, etc.)
- Select the key attributes that complete customer profiles (name, phone number, email address, geographical address, etc.)
- Define metadata of selected attributes (data type, size, format, pattern, etc.)
- Explain the acceptable quality thresholds or criteria for the data stored (e.g., customer names must be 100% accurate at all times, while their product preferences can tolerate up to 95% accuracy rate).
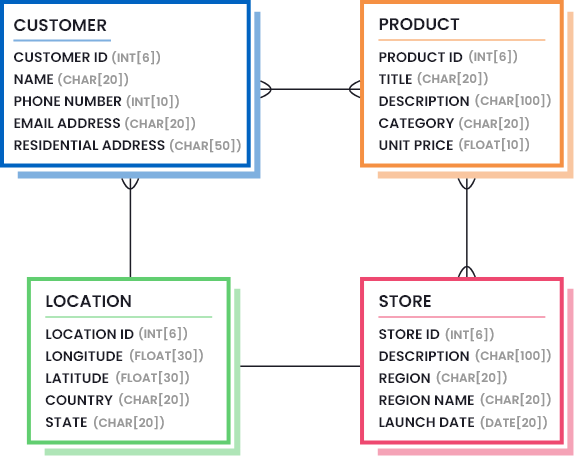
This information is usually defined by drawing data models that outline the necessary parts of data (the amount and quality of data that is considered good enough). Consider the following image to understand what a data model might look like for a retail company:
Furthermore, you need to identify the data quality metrics and their acceptable thresholds. A list of most common data quality metrics is given below, but you need to select the ones that are helpful in your case, and figure out the least percentile values that represent good data quality.
- Accuracy: How well do data values depict reality/correctness?
- Lineage: How trustworthy is the originating source of data values?
- Semantic: Are data values true to their meaning?
- Structure: Do data values exist in the correct pattern and/or format?
- Completeness: Is your data as comprehensive as you need it to be?
- Consistency: Do disparate data stores have the same data values for the same records?
- Currency: Is your data acceptably up to date?
- Timeliness: How quickly is the requested data made available?
- Reasonableness: Do data values have the correct data type and size?
- Identifiability: Does every record represent a unique identity and is not a duplicate?
Next, it’s important to identify relevant data quality metrics and establish their acceptable thresholds.
Here’s a list of most common data quality metrics is given below, but you need to select the ones that are helpful in your case, and figure out the least percentile values that represent good data quality.
- Accuracy: How well do data values depict reality/correctness?
- Lineage: How trustworthy is the originating source of data values?
- Semantic: Are data values true to their meaning?
- Structure: Do data values exist in the correct pattern and/or format?
- Completeness: Is your dataset as comprehensive as you need it to be?
- Consistency: Do disparate data stores have the same data values for the same records?
- Currency: Is your data acceptably up to date?
- Timeliness: How quickly is the requested data made available?
- Reasonableness: Do data values have the correct data type and size?
- Identifiability: Does every record represent a unique identity and is not a duplicate?
Assess Current Datasets Against Defined Metrics

The first step in data quality assessment helps you to define the targets. Once the data quality goals are defined, the next step in data quality assessment framework is to measure how well your current data performs against the set targets. This step is usually performed by generating detailed data profile reports. Data profiling is a process that analyzes the structure and contents of your datasets and uncovers hidden details.
Once data profile reports are generated, you can now compare them against the set target.
For example, if your target is that customers must have a first and last name; but the data profile report shows 85% completeness on customer name, you know there’s 15% missing information that needs to be addressed.
2. Design

The next step in data quality framework is to design the business rules that ensure conformance with the data model and targets defined during the assessment stage.
The design stage consists of two main components:
- Selecting the data quality processes you need and fine-tuning them according to your needs,
- Deciding where to embed data quality functions (architectural design).
Let’s look at these in more detail.
Select Data Quality Processes

Depending on the state of your data, you need to select a list of data quality processes that will help you to achieve the desired quality state. Usually, a number of data quality processes are performed to fix errors or transform data into the required shape and structure.
Below, we have listed the most common data quality processes used by organizations. The order in which they should be implemented on upcoming or existing data is your choice. The examples provided for each process will help you to navigate whether this process is useful for your case or it can be skipped.
a. Data parsing and merging

Data parsing means analyzing long strings and dividing sub-components into one or more columns. This is usually done to get important elements in separate columns so that they can be:
- Validated against a library of accurate values,
- Transformed into acceptable formats, or
- Matched with other records to find possible duplicates.
Similarly, sub-components are merged together to get more meaning out of individual fields.
Example:
Parsing Address column into Street Number, Street Name, City, State, Zip Code, Country, etc.
b. Data cleansing and standardization

Data cleansing and standardization is the process of eliminating incorrect and invalid information present in a dataset to achieve a consistent and usable view across all data sources.
Example:
- Removing null values, leading/trailing spaces, special characters, etc.,
- Replacing abbreviations with full forms, or repetitive words with standardized words,
- Transforming letter cases (lower to upper, upper to lower),
- Standardizing values so that they follow the correct pattern and format, and so on.
c. Data matching and deduplication

Data matching (also known as record linkage and entity resolution) is the process of comparing two or more records and identifying whether they belong to the same entity. If multiple records are found to be a match, the main record is retained, and the duplicates are removed to attain the golden record.
Example:
If customer information at your company is captured and maintained at different sources (CRM, accounting software, email marketing tool, website activity tracker, etc.), you will soon end up with multiple records of the same customer. In such cases, you will need to perform exact or fuzzy matching to determine the records belonging to the same customer, and the ones that are possible duplicates.
How best-in class fuzzy matching solutions work
Read this whitepaper to explore the challenges of matching, how different types of matching algorithms, how a best-in-class software uses these algorithms to achieve data matching goals.
Downloadd. Data merge and survivorship

Once you find duplicate records in your dataset, you can simply delete the duplicates or merge them together to retain maximum information and prevent data loss. Data merge and survivorship is a data quality process that helps you to build rules that merge duplicate records together through conditional selection and overwriting.
Example:
You may want to keep the record that has the longest Customer Name and use it as the master record, while overwriting the longest Zip Code from the duplicate record onto the master one. A prioritized list of such rules will help you to get the most out of your dataset.
e. Custom validation or dependency rules
Apart from the standardized data quality processes, you may have custom validation rules that are unique to your business operation.
Example:
If a customer has made a Purchase of Product A, they can only avail a Discount of up to 20%. (Meaning: If Purchase = Product A, then Discount should be <= 20%).
Such business-specific dependency rules must be validated to ensure high data quality.
Decide Architectural Design
Now that we have taken a look at some common data quality processes used in a data quality framework, it’s time to consider a more important aspect: how are these data quality operations embedded in your data lifecycle?
There are multiple ways that this is possible, including:
1. Implementing data quality functions at input – this can involve putting validation checks on web forms or application interfaces used to store data.
2. Introducing middleware that validates and transforms incoming data before storing it in the destination source.
3. Putting validation checks on database, so that errors are raised while storing data in the data store.
Although the first way seems best, it has its own limitations. Since an average organization uses 40+ applications, it is difficult to synchronize each input source to produce the required output.
To know more, check out: How are data quality features packaged in software tools?
3. Execute

The third stage of the cycle is where the execution happens. You have prepared the stage in the previous two steps, now it’s time to see how well the system actually performs.
It is important to note that you may need to execute the configured processes on the existing data first and ensure its high quality. In the next phase, you can trigger execution on new upcoming streams of data.
4. Monitor

This is the last stage of the framework where the results are monitored. You can use the same data profiling techniques that were used during the data quality assessment stage to generate detailed performance reports. The goal is to see how well the data conforms to the set targets, for example:
- Incoming data is parsed and merged as needed,
- The required attributes are not null,
- Abbreviated words are transformed as needed,
- Data is standardized according to the set format and pattern,
- Possible duplicates are merged together or deduplicated,
- Possible duplicates are not created as new records,
- Custom business rules are not being violated, etc.
Moreover, you can also set some thresholds for data quality measurement, and trigger alerts in case data quality deteriorates even a bit below these levels.
10 things to check when profiling your data
Data profiling is a crucial part of data conversion, migration and data quality projects. Download this whitepaper and find out the ten things to check when profiling your data.
DownloadAnd here we go again…
A data quality cycle or framework is an iterative process. Once you’ve reached the data monitoring stage, a few data quality errors might arise. This shows that the defined framework still has some gaps that caused errors to fall through. For this reason, the assessment stage must be triggered again, which consequently triggers the design and execution phases. In this way, your data quality framework is constantly upgraded and perfected to meet your data quality needs.

When Is the Cycle Iterated?
There are two ways to trigger the assessment stage:
1. Proactive Approach
In this approach, you can select a regular date and time when the generated performance reports are analyzed and in case any errors are encountered within that timeframe, the assessment stage is triggered again. This approach helps you to keep an eye out on possible errors that may arise.
2. Reactive Approach
As the name suggests, the assessment stage is triggered when a data quality error is encountered. Although both approaches have their own benefits, it is best to apply both to your data quality framework so that the state of data quality is constantly proactively monitored as well as taken care of at the time any errors occur.
Conclusion
Data quality is not a one-stop destination. It is something that constantly needs to be assessed and improved. For this reason, it is very crucial to design comprehensive frameworks that continuously manage the quality of multiple datasets. Utilizing standalone data quality tools can be very productive for this case – given that they have the ability to:
- Integrate in the middle of your input and output sources,
- Perform detailed analysis to generate data profile reports,
- Support various data quality processes that can be finetuned and customized as needed,
- Offer batch processing or real-time processing services, and so on.
DataMatch Enterprise is one such solution – available as a standalone application as well as an integrable API – that enables end-to-end data quality management, including data profiling, cleansing, matching, deduplication, and merge purge.
You can download the free trial today, or schedule a personalized session with our experts to understand how we can help you to design a data quality framework for your business.
Getting Started with DataMatch Enterprise
Download this guide to find out the vast library of features that DME offers and how you can achieve optimal results and get the most out of your data with DataMatch Enterprise.
Download